Key Takeaways
- The best real estate markets for out-of-state investors aren’t the cities on a “top 10” list. Those lists are written by turnkey companies and lenders who don’t own what they’re ranking. The right market is the one that survives a screen.
- I screen every market against 6 criteria before it earns a shortlist spot: population and job growth, neighborhood class, price-to-rent ratio, landlord law, carrying costs, and contractor depth.
- Two of the six are non-negotiable — population and job growth, and a neighborhood class you can actually manage from a distance. Fail either one and the market is dead, no matter how good the other four look.
- I learned this with real money. In 2021 I bought five properties in Cleveland. On my scorecard today, Cleveland passes 4 of 6 criteria — and I still exited every single one of them.
- A high price-to-rent ratio in a shrinking city is a trap. Cash flow can’t rescue you from a market that isn’t growing. Pick the market trajectory first, then optimize the deal.
IN THIS ARTICLE
- How a Remote Investor Actually Picks a Market
- Why the ‘Best Real Estate Markets for Out-of-State Investors’ Lists Are Wrong
- The Cleveland Mistake: A Market That Passed on Paper
- The 6 Criteria I Screen Before a Market Makes My Shortlist
- How I Score a Market (And Why Cleveland Still Failed)
- What Most People Get Wrong About Market Selection
- So Where Should You Actually Invest in 2026?
- Frequently Asked Questions
How a Remote Investor Actually Picks a Market
In 2021 I bought a house in Cleveland for $88,000. I put $6,000 of rehab into it. It appraised at $146,000. On paper that is close to a perfect BRRRR — almost no rehab, a huge equity spread, $350 a month in cash flow. I sold it in 2026.
I sold it because the deal was never the problem. The market was. The best real estate markets for out-of-state investors are not the cities on a “top 10” list — they’re the ones that survive a screen. Cleveland didn’t. I bought five properties there that year, and I spent the next five years quietly exiting all of them.
This post is the six-criteria screen I run now, before a single property gets analyzed. It’s the screen I didn’t have in 2021. I’ll also show you my own scorecard — the three markets I’ve actually bought in, scored honestly, including the one I got wrong. If you’re still deciding whether to invest at a distance at all, start with my honest answer on whether out-of-state real estate investing is worth it and come back here for the market question.
Why the ‘Best Real Estate Markets for Out-of-State Investors’ Lists Are Wrong
Search that phrase and you get the same article fifteen times: a ranked list of cities, usually with Dallas, Tampa, and a couple of Sun Belt names you’ve already heard. Read the byline. The list is almost always published by a turnkey company that happens to sell inventory in those exact cities, a lender that wants the loan volume, or an aggregator that gets paid by the click. None of them own a rental on the streets they’re ranking.
That’s the first problem. The second is that a ranked list is a snapshot. It’s last quarter’s data, dressed up as a recommendation, and it’s stale by the time you read it. Markets don’t move that fast — but the list format implies a precision that isn’t real.
The third problem is the one that actually cost me money. A list can’t account for you. It doesn’t know your capital, your strategy, or the fact that you’ll be running this from another state — or, in my case, another country. A market that works beautifully for a local investor with a contractor crew on speed dial can be a grind for someone managing from 7,000 miles away. The list ranks cities. It doesn’t ask whether you can operate there.
So throw out the list. What you need isn’t a ranking — it’s a repeatable screen.
The Cleveland Mistake: A Market That Passed on Paper
Here’s what made Cleveland so easy to get wrong.
In 2021 I was chasing cash flow. Cleveland delivered it on a spreadsheet better than almost anywhere. Houses were cheap — I bought five between $80,000 and $93,000. Rents were strong relative to those prices, so the price-to-rent ratios were excellent. Every property I analyzed cleared my numbers. One of them, the $88k house, needed only $6k of work to hit a $146k appraisal. I called it a perfect BRRRR. I thought I was building an empire.
What the spreadsheet didn’t show: the houses were in neighborhoods that were hard to keep stable. Tenant turnover was constant. Maintenance calls never stopped — older housing stock, rougher streets, the kind of property where something is always breaking and every fix costs more than you budgeted. From Israel, I couldn’t drive over to see what was actually going on. I was managing a problem I couldn’t see, in a market that wasn’t growing underneath me.
And it wasn’t growing. That’s the part that mattered most. Cleveland’s population has been roughly flat to declining for years. Flat population means flat rents and flat values — no tailwind, ever. So I had a portfolio that demanded constant attention, never appreciated, and never grew its rents, while I told myself the price-to-rent ratio meant it was a good investment.
I exited all five between 2023 and 2026. Some at a small loss, some at break-even, one of the partnership deals roughly flat. The honest scorecard: every property analysis I ran in 2021 was fine. I never ran the market analysis. That’s the difference this post exists to fix.
The 6 Criteria I Screen Before a Market Makes My Shortlist
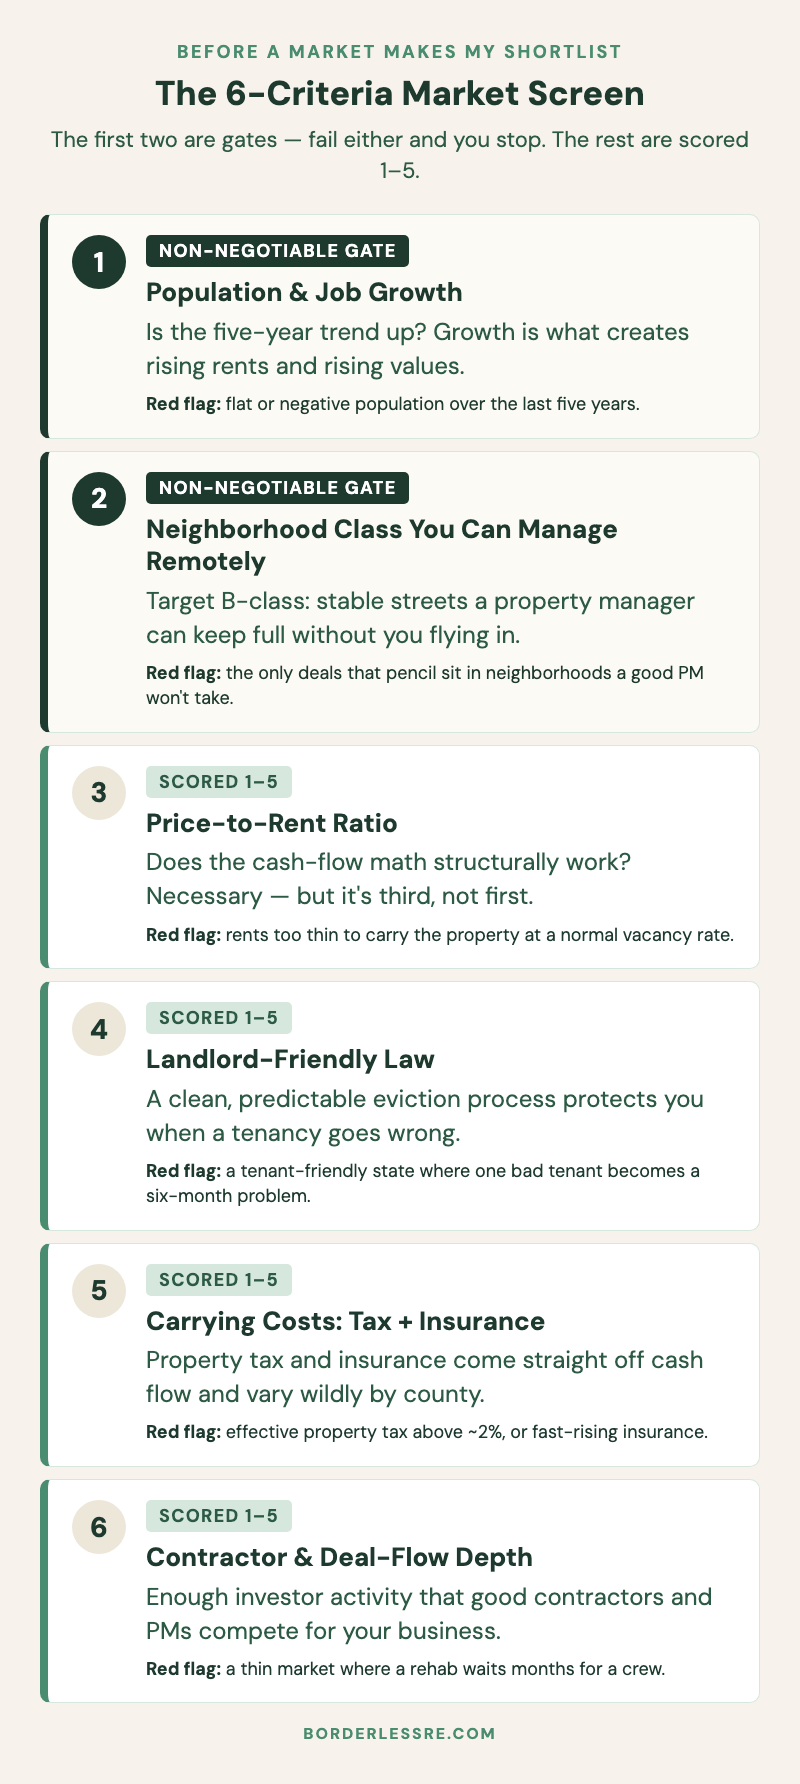
After Cleveland I built an actual screen. Six criteria. The first two are gates — pass/fail, non-negotiable. The other four are scored 1 to 5 so I can compare the markets that made it through the gates.
1. Population and Job Growth (Non-Negotiable)
Is the market growing? Not “did it have one good year” — is the five-year trend up. Population growth is what creates rent growth and value growth; without it you’re holding a static asset and hoping. The US Census Bureau publishes free metro and county population estimates every year, and the Bureau of Labor Statistics tracks job growth and unemployment by metro. Red-flag threshold: flat or negative population over five years. Cleveland failed this. It’s the first thing I check now because it’s the one thing I can’t fix.
2. Neighborhood Class You Can Manage Remotely (Non-Negotiable)
A market is not one thing — it’s a stack of neighborhoods, from A-class down to D-class. For a remote investor the realistic target is B-class: solid working neighborhoods where a property manager can keep a property stable without you flying in. C and D class can show seductive price-to-rent ratios, but they come with turnover, maintenance, and management intensity that punishes distance specifically. Red-flag threshold: if the only deals that pencil are in neighborhoods a good PM won’t touch, the market fails.
3. Price-to-Rent Ratio
Now the math. Price-to-rent tells you whether the cash flow is structurally possible. Lower-priced markets with healthy rents make BRRRR and buy-and-hold work; expensive markets with weak rents don’t. This is the criterion the listicles over-weight — it’s necessary, but it’s third on my list, not first. Score it 1 to 5.
4. Landlord-Friendly Law
Tenant law is set at the state level and it decides how fast you can resolve a problem. A landlord-friendly state with a clean, predictable eviction process protects you when a tenancy goes wrong — and tenancies go wrong. Tenant-friendly states can turn a single bad tenant into a six-month, five-figure problem you’re managing from a time zone away. Score 1 to 5.
5. Carrying Costs: Property Tax Plus Insurance
These two costs come straight off your cash flow every month, and they vary enormously by location. Property tax especially — the Tax Foundation’s property tax data shows effective rates ranging from under 0.3% to well over 2% depending on the state and county. Insurance is climbing fastest in coastal and disaster-exposed markets. A market can have a great price-to-rent ratio and still bleed once you load real taxes and insurance on top. Score 1 to 5.
6. Contractor and Deal-Flow Depth
Can you actually operate here? You need a market with enough investor activity that good contractors, agents, and property managers exist and compete for your business — and enough deal flow that you’re not waiting six months for something to analyze. Thin markets look cheap and quiet until you try to get a rehab done. Score 1 to 5.
How I Score a Market (And Why Cleveland Still Failed)
Here’s the part most market guides skip entirely: how do you weigh the criteria against each other? What happens when a market is strong on four and weak on two?
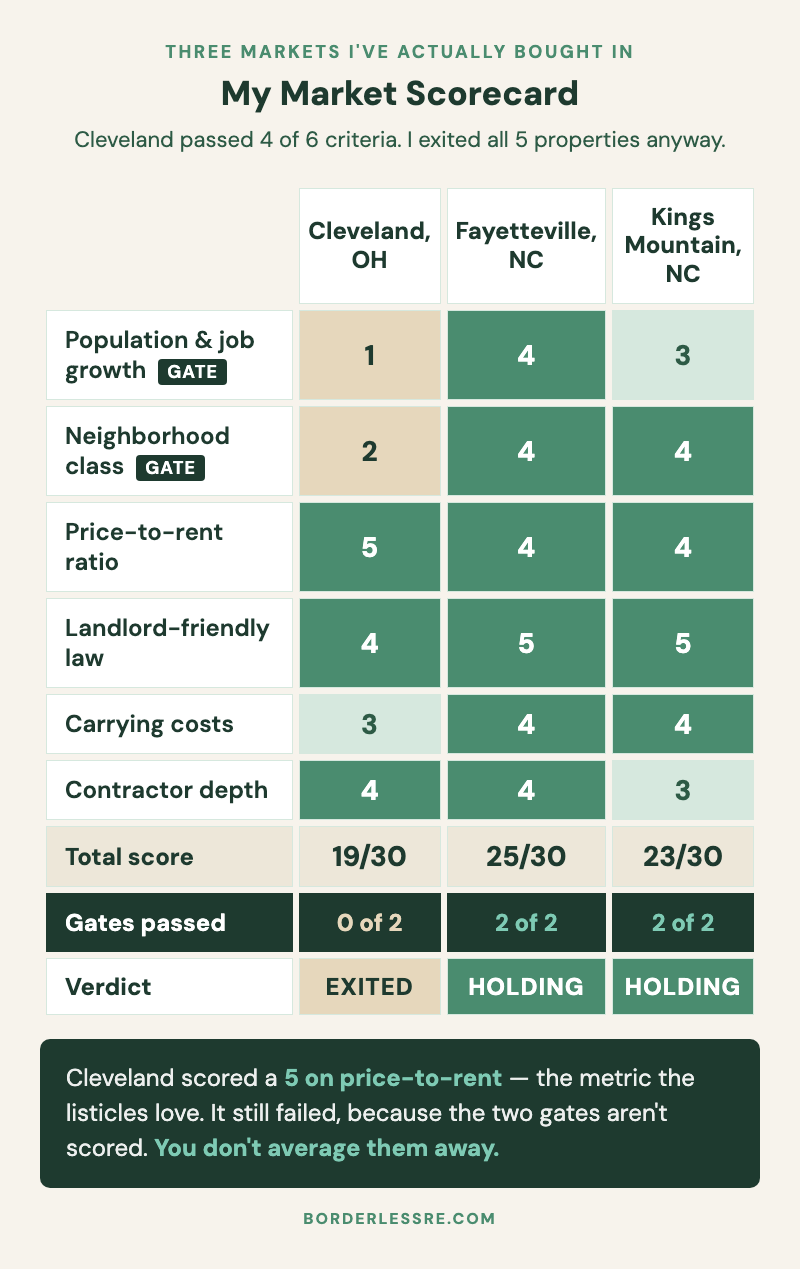
Look at Cleveland on that scorecard. It scores a 5 on price-to-rent — genuinely excellent. It clears landlord law at a 4; Ohio’s eviction process is workable. Contractor depth is a 4 — Cleveland has a deep investor ecosystem. Even carrying costs scrape a 3, though Ohio’s property taxes are high, especially in Cuyahoga County, so that one was marginal. Add it up and Cleveland passes 4 of 6.
And I still exited every property. Because the two it failed — population and job growth, and neighborhood class — are not scored criteria. They’re gates. You don’t get to average them away. A 5 on price-to-rent cannot buy back a 1 on growth, because growth is the thing that makes a 20-year hold worth holding.
Compare that to Fayetteville, North Carolina, where I’ve done multiple deals: steady growth anchored by a major military installation, B-class neighborhoods a property manager can keep full, strong landlord law, low carrying costs. It clears both gates and scores well on the rest. Kings Mountain — outside the Charlotte metro — clears the gates too, with slightly thinner contractor depth as a small-town trade-off I priced in.
The scorecard isn’t a sum. It’s two gates, then a comparison. That structure is exactly what I didn’t have in 2021. And the neighborhood-class gate is also a property manager question — a B-class market only stays a B-class investment if you can put a manager in place who keeps it that way.
What Most People Get Wrong About Market Selection
The single most common mistake — and the one I made — is optimizing for the most visible number.
Price-to-rent ratio and projected cash flow are the easiest metrics to see. They’re right there on the spreadsheet, they feel concrete, and a fat cash-flow number is satisfying in a way that “five-year population trend” never will be. So that’s what people optimize for. They find the cheap house with the great ratio, the cash flow clears their threshold, and they buy.
But cash flow in a declining market is a melting ice cube. The rents don’t grow because the population isn’t growing. The maintenance costs climb every year as the housing stock ages. There’s no appreciation to build equity. And when you finally want out, your buyer pool is every other investor who also realized the market wasn’t going anywhere. You collected $300 a month for a few years and called it income, while the asset underneath quietly went nowhere.
Here’s the reframe that changed how I invest. The market is the one variable you cannot fix with effort. You can fire a bad property manager and hire a better one. You can replace a contractor. You can refinance a bad loan when rates drop. You can even sell a single bad property and move on. You cannot fix a shrinking city. Everything else in this business is operational and fixable. The market is structural.
That’s also why I think about cash flow the way I do — as the reward at the end, not the target you chase into the wrong place. Equity growth is what actually builds a portfolio, and equity growth comes from the market’s trajectory. Pick a growing market with a B-class core and decent law, and the cash flow shows up on its own as rents rise. Chase the cash flow into a declining market and you get neither.
So Where Should You Actually Invest in 2026?
I’m not going to hand you a city. The honest answer is a profile, not a name — because the right market depends on your strategy and your capital, and because a list would just make me the sixteenth article doing the thing I told you to ignore.
But the data points clearly in one direction. The Census Bureau reports that the nation’s 387 metro areas grew by about 3.2 million people — 1.1% — in a single recent year, and 9 of the 10 fastest-growing metros were in the South. The Southeast and Sun Belt are where population is actually moving.
So the profile that survives my screen in 2026 looks like this: a mid-size metro in a growing Southeast or Sun Belt state, with a real B-class core, landlord-friendly law, low property taxes, and enough investor activity to support contractors. That’s a description, not a destination. Run it against the six criteria and a handful of markets will surface.
For what it’s worth, 20 of my 24 deals are in North Carolina. Not because North Carolina is “the best state” — that phrase is the listicle trap again — but because it keeps clearing my screen. Steady growth, genuinely landlord-friendly law, low carrying costs, deep contractor networks in the metros I work. It has the things Cleveland didn’t. That’s the whole reason I’m there.
Your screen might surface a different state, and that’s fine — the screen is the point, not my answer. If you want the full operating system behind running a portfolio at a distance once you’ve picked the market, that’s the long distance real estate investing playbook. Market selection is step one. It just happens to be the step that’s hardest to undo.
Frequently Asked Questions
What is the best state for out-of-state real estate investing?
There isn’t a single best state — it depends on your strategy and capital. But the states that consistently clear a growth-first screen in 2026 are in the Southeast and Sun Belt: North Carolina, South Carolina, Georgia, Florida, Tennessee, and Texas. Census data shows 9 of the 10 fastest-growing metros are in the South. I invest in North Carolina because it pairs that growth with landlord-friendly law and low property taxes — but the screen matters more than the state name.
Is it better to invest where I live or out of state?
It’s better to invest where the numbers and the market trajectory work. If you live in an expensive, slow-growth, or tenant-friendly market, staying local just to be near your properties is a bad trade. I invest 7,000 miles from where I live. The distance is a solvable operations problem. A bad market is not.
How many markets should an out-of-state investor be in?
One, until it’s genuinely working without you. Every market needs its own agent, contractor, and property manager — three real relationships to build and maintain. I only expanded to a second market after the first one ran on its own. Most investors who stall do it by spreading across three markets before they’ve proven one.
What’s the biggest mistake people make when picking a market?
Picking the property before picking the market. They find a cheap house with a great price-to-rent ratio, get excited by the cash flow, and never ask whether the city itself is growing. That’s exactly what I did in Cleveland. The property analysis was fine. I never ran the market analysis.
Should I avoid expensive markets like the coasts?
Not because they’re expensive — because the math usually doesn’t work there for a cash-flow or BRRRR strategy. High-cost coastal markets tend to have weak price-to-rent ratios and, in many cases, tenant-friendly law. If your strategy is long-horizon appreciation and you have the capital to carry it, some of those markets can work. For most remote investors building a rental portfolio, mid-size growing metros are the better screen result.
How do I check whether a market is actually growing?
Start with the Census Bureau’s metro and county population estimates — free and updated every year. Look for steady year-over-year gains over the last five years, not a single good year. Then cross-check job growth and unemployment through the Bureau of Labor Statistics. If population is flat or shrinking, stop there — it failed the first gate.
Cleveland taught me the most expensive lesson in my portfolio: a good deal in the wrong market is still the wrong move. I had the property math right every single time. I just never checked whether the city underneath those properties was going anywhere.
Run the six-criteria screen before you fall in love with a listing. Population and job growth. Neighborhood class you can manage from a distance. Price-to-rent ratio. Landlord law. Carrying costs. Contractor depth. The first two are gates — fail either and you stop, no matter how good the spreadsheet looks. The other four are how you compare the markets that survived.
If you want to know whether your market knowledge is actually a strength or a gap before you commit capital, the Remote Investor Readiness Score measures exactly that. It’s ten questions, and one of the five dimensions it scores is Market & Deal Knowledge. It’ll tell you where you stand — no course, no pitch, just the score and the next thing to work on.
Find out exactly where you stand before your first deal.
10 questions. A personalized score across 5 dimensions. Free.
Get my readiness score →